N
ot everything looks bleak these days, certainly when it comes to textile labor costs.
Examine the latest industry productivity and payroll figures, and it’s clear industry unit labor
costs have actually trended lower over the past year.
Look at productivity first — figures (showing a 10-percent decline in the industry workforce
and only a 3-percent decline in output) point to an annual efficiency gain of nearly 7 percent. Pay
increases for textile workers over the same period have averaged out in the relatively low 1.5- to
3.5-percent range. The two pertinent figures (a 7-percent productivity advance and a 1.5- to
3.5-percent pay gain) provide pretty strong evidence that textile unit labor costs have fallen
anywhere from 3.5 to 5.5 percent over the past 12 months.
But Man-Made Fiber Tags Rise
Rising man-made fiber and yarn costs, however, are now a problem, offsetting some of the
positive effects of lower wage costs. To be sure, some of the upward impetus here comes from
firming demand. But a more important factor is probably a big jump in the cost of petrochemical
feedstocks as crude oil and natural gas prices head for new highs.
These costs are not trivial. Some two-thirds of polyester staple’s selling price is traceable
to petrochemicals. No surprise, then, that there recently have been posted increases in such key
areas as polyester and nylon. And given current trends, these increases are likely to continue into
summer and fall.
These advances haven’t as yet shown up in the government man-made fiber index — there’s
always a few months’ lag here.
TW
would expect this key textile price barometer to advance anywhere from 2 to 4 percent
over the next six months — with the biggest hikes likely to be centered in commodity rather than
specialty products.
Cotton Bears Watching Too
Cotton tags haven’t been nearly as firm as expected. Indeed, prices here recently were down at a
10-month low and not much above a year ago. Much of this can be attributed to less-than-expected
Chinese purchasing. Quotes are probably as low as they’re going to go, as global consumption this
year will top production by several million bales. Many analysts now maintain the natural fiber is
undervalued. TW would tend to agree, and expects spot prices to inch up slowly from recent lows.
Best bet for the next six months: a price average in the mid-60s range. While somewhat under
early-2004 highs, that would still be above the latest reported results.
Some Thoughts On Imports
Meantime, there’s also somewhat more encouraging news on the trade front. Incoming shipments so
far this year are up only 6 to 7 percent on a square meters equivalent basis. That’s well under
last year’s 9- to 10-percent advance and pretty much in line with TW‘s beginning-of-the-year
forecast.
A good portion of the market most vulnerable to easy Chinese penetration has already been
captured. Equally important are ongoing technological advances — witness continuing big jumps in
productivity — that the US industry has been achieving to remain competitive. Closely allied with
this are the ongoing development of new and improved products and increasing emphasis on flexible
manufacturing that allows domestic producers to attract customized markets.
Another factor could be the recent increase in textile import prices as the US dollar
weakens. At last report, import quotes were running better than 3 percent above a year earlier, in
marked contrast to the virtually flat pattern noted for domestic textile tags.
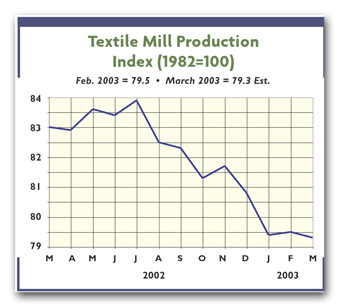
A Statistical Note
TW
’s textile mill products price index shown on page 20 has been revised to reflect ongoing
changes in overall industry data collection — away from the old Standard Industrial Classification
approach and towards the new North American Industrial Classification System (NAICS). Since past
data under the NAICS breakdown are not available, the new series uses December 2003 as its
reference point.
This revision has resulted in lower index numbers than under the old 1982 base. Also note
that by linking the old and new series together,
TW
believes the chart presents realistic estimates of the month-to-month changes that have
occurred over the past year.
May 2004