O
ne of the joys of writing regularly for
Textile World
is the opportunity to keep abreast of happenings in an industry that has had many happy
years. One of the frustrations is the limited availability of time and space, thereby causing many
smaller stories interesting in themselves but not sufficiently large enough to command an entire
three- or four-page allotment to be relegated to the trash bin. And so, this month
TW
has developed and delivered three smaller stories. They are not directly connected, but are
related tangentially as they refer to the surprisingly similar reactions to imports and exports by
three different segments of the textile market.
Cotton
According to Fiber Organon – the Arlington, Va.-based Fiber Economics Bureau’s (FEB’s) monthly
statistical journal that summarizes confidential producer information on the US manufactured fiber
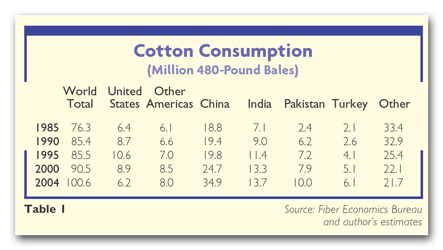
market – 2004 world cotton fiber consumption amounted to 102,612 thousand bales – up 2.6
percent from 2003 levels; above the 1-plus-percent rate of the past 15 years but consistent with
the 2-plus-percent rate achieved since cotton resumed its surging growth late in the last century.
There really is nothing unusual about the change in rate, except this one is accompanied by a
substantive change in the relative positions of supply and demand participants
(See Table 1). After acknowledging that cotton is consumed everywhere, it is obvious the
number of active participants has narrowed severely. China increased its share in the period from
1985 to 2004 from 25 percent to 35 percent. The Americas dropped from 16 percent to 14 percent.
India grew from 9 percent to 14 percent; Pakistan, 3 percent to 10 percent; and Turkey, 2 percent
to 6 percent. While the market grew at a 1-plus-percent compounded rate, other consumers dropped
share from 44 percent to 28 percent. This concentration of power bodes ill for equal treatment, at
least in cotton goods. Recent announcements about the quantities of Asian merchandise arriving on
US shores since the advent of a full World Trade Organization (WTO) attest to this fact.
Counterintuitively, traditional man-made fiber-producing countries such as Korea, Taiwan and Japan,
whom one would expect to share in cotton’s growth, also dropped cotton market share in the period.
The availability of land, vis-á-vis foodstuffs, leads the number of reasons. India, Pakistan and
China picked up the slack.
An additional calculation by the FEB points out another change. In 1985, the United States
consumed 6.4 million bales of domestically produced cotton and exported a historically low 2
million bales, resulting in an excessively large carryover. (Authors note: Exports in the United
States in the 80s averaged more than 6 million bales annually. There is no purported reason for the
1985 anomaly.) By 2004, the United States was consuming the same 6-plus million bales, but by now
was exporting more than 11 million bales. The concept of export is laudable; the concept of
exporting raw materials ignores the reasons – primarily value-added for engaging in trade. In the
interests of effective use of capital, is growing and exporting 11 million bales of cotton the best
use for the required resources, including acreage
Solutia Redux
TW
has commented on St. Louis-based Solutia Inc.’s exit from the acrylic business
(See Oh Mexico, Where Art Thou?,
www.TextileWorld.com, March 2005).
Sadly, the restructuring surrounding the company’s Chapter 11 bankruptcy filing continues, this
time with recent news the company intends to shutter part of its Pensacola, Fla., nylon facility,
lay off a number of employees and exit some portions of the industrial nylon fiber business. True,
some activities are being transferred to the Greenwood, S.C., nylon operation, which, being some
years newer than the Pensacola facility, contains sufficiently modern equipment that will enable
the company to remain competitive in portions of the industrial yarn industry.
It’s probably fair to say this exit is not unexpected. Several times in the past,
TW
has commented on the surge by domestic polyester producers into industrial market uses. The
last five years have seen polyester increase its share in the 300 million pounds of domestic
shipments to original equipment and replacement tire manufacturers from a majority 55-percent share
to a dominant 72-percent share of 2004’s smaller 235 million-pound market.
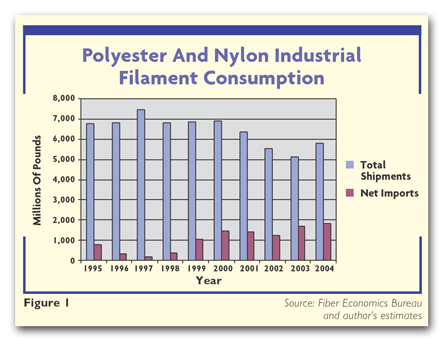
Polyester has maintained its shipment level in the 165 million- to 170 million-pound range;
nylon has borne all the losses. Unfortunately, it appears the industry’s assumptions of a safe
harbor for nylon and polyester in industrial end-uses are fallacious. Figure 1 highlights the
evolving import position.
As domestic polyester squeezed nylon out of many industrial end-products such as tires, hoses,
seat belts and airbags, offshore polyester producers – in particular the leading five of which are
Canada, Mexico, Korea, Japan and Taiwan – spotted opportunities in the United States and
increasingly poured high technology fibers into the market at a rate increasing by a compounded
14-plus percent every year, driving down the US presence in world markets. The quality of imported
yarn, made using the latest equipment, gradually improved, and imports rapidly siphoned off 30
percent of nylon usage and 36 percent of polyester usage. To emphasize the importance of the
industrial business, one week after announcing the Pensacola decision, Solutia announced a
10-percent price increase on industrial filament yarns. No wonder it had to throw in the towel.
Apparel Versus Non-Apparel Imports
The FEB recently introduced a new data series measuring the imports of textiles and apparel in
millions of square meter equivalents (smes). This in itself is not new, but the presentation
includes separating the imports into apparel and non-apparel categories. The originating data
source is the Office of Textiles and Apparel (OTEXA) within the Department of Commerce, which
reports that in 2004, the United States imported 46 billion smes of textiles of all fibers in the
form of apparel and non-apparel items – a 21-percent increase over 2002 totals. More interesting
than the totals is the split – almost 20 billion smes entered as apparel, but 26 billion smes came
in as non-apparel. In square meter terms, non-apparel exceeded apparel by 36 percent.
But, consider which category makes the news. The answer appears analogous to complaining about
paying $2.25 per gallon – 1-3/4 cents per ounce for automobile fuel while you sip your 10-ounce
Starbucks latte for which you paid $4.00 – 40 cents per ounce. This article is, in a sense, an
obituary for apparel. In early 2005, China, under the auspices of WTO membership, has increased
apparel-dominated shipments to the United States, maybe in sufficient quantity to energize a
political response. Meanwhile, remaining textile industry assets such as industrial and home
fashions items, presumably locked safely in the barn, are being deluged by imports in quantities
never before imagined by mills and manufacturers. Many of the non-apparel items are home fashions
like linens, but increasingly napery, upholstery fabrics and upholstered furniture are being
imported. The barbarians are at the gate; markets the US industry had falsely assumed would resist
imports are under siege; and the focus continues to be on a fait accompli – the export of the
apparel industry.
A Common Thread
While these three reports appear dissimilar, they are joined by the common thread of vision. US
cotton production remains high despite the dramatic slowing of cotton demand by US manufacturers.
Solutia’s Pensacola plant, hobbled by bankruptcy court proceedings, lags in investment with a
less-desired product that will not allow it to effectively compete in an increasingly technological
world. Worldwide manufacturers of non-apparel items appear poised to repeat the market penetration
strategies that have been so successful in the past several decades. Industry responses generally
have been reactive and, frankly, less than successful – US companies shut down facilities and lay
off dedicated workers and divert investment to exporting excess raw materials when it is arguable
that a better investment return combined with new, higher-technology jobs would be a more desirable
result. Isn’t it time for this industry to be more realistic about the future of textiles after
almost 50 years of increasing penetration and disruption by a never-ending parade of
developing-nation candidates?
May 2005