I
n most cases, raw material costs are more than 50 percent of the total manufacturing
expenses in a spinning mill. Therefore, it is of fundamental interest for the spinner to know and
to monitor the quality characteristics of the fibers to reduce costs and to optimize the spinning
process. Electronic quality management systems are able to reduce the amount of raw material all
along the spinning process.
With the precise measurement of yarns, rovings and slivers in the past 60 years, the
spinning machinery manufacturers improved the spinning process and reduced the mass variation of
fiber assemblies. This improvement was an opportunity not only to increase productivity, but also
to reduce considerably the raw material costs, which is in the basic interest of every spinner.
Therefore, spinning mills always have had a considerable interest in knowing the quality
characteristics of fibers to reduce costs and optimize the spinning process.
Sixty Years Of Textile Electronics
The year 2008 marks the 60th anniversary of textile electronics – six decades during which
Switzerland-based Uster Technologies AG has played an important role in improving measuring
technology in the textile industry. The company celebrated the 60th birthday of the first yarn
evenness testing instrument with a reception and a big cake in Shanghai during ITMA Asia + CITME
2008.
The first mechanical spinning mills started operating at the end of the 18th century. For
more than 150 years, however, the textile industry had poor testing instruments. The yarns had to
be checked visually either by stretching a few yarns manually or by inspection on the famous
blackboard (See Figure 2).
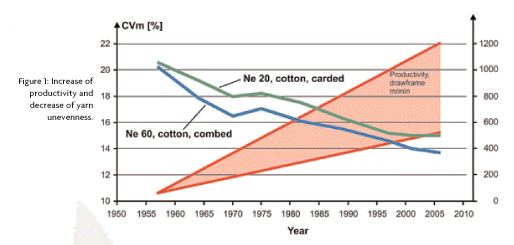
Figure 1 shows the dramatic productivity improvement of drawing frames and the reduction of
yarn unevenness during the same period. The lines for Ne 20 and Ne 60 in Figure 1 were derived
using Uster® Statistics quality benchmarks over the past 50 years. The mean yarn evenness of a
combed cotton yarn dropped from a coefficient of variation (CV) of 20.2 percent in 1957 to a CV of
13.7 percent in 2007. During the same period, the productivity of spinning machinery could be
increased considerably.
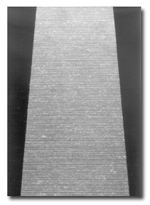
Figure 2: Visual check on blackboard, 1945
History Of Textile Electronics
Between 1935 and 1945, the progress in electronics was enormous because of tremendous
efforts in the industry to produce sophisticated military equipment. These new electronic
components were applied after World War II for all kinds of improvements in measurement technology.
One area of application was the textile industry. In 1950, it took 30 minutes just to determine the
fiber length with the help of an end-aligned staple diagram apparatus. With modern fiber-testing
systems, more than 10 quality characteristics can be determined in a few seconds.
Uster developed its first evenness tester between 1944 and 1948. A few years later, Spinlab,
a small company in Knoxville, Tenn., developed the first electronic measuring instrument for the
determination of the length of cotton fibers.
Semiconductors Cause A Big Boost
Two big boosts in textile electronics were the availability of semiconductors as signal
amplifiers and the development of the first transistor in 1949. As transistors were much smaller
than electronic vacuum tubes, this advance laid the groundwork for the more compact online sensors
10 years later. The first yarn evenness tester could determine the mass variation of yarns with a
capacitive sensor (See Figure 3). This mass variation was recorded by means of an ink recorder.
In 1951, Uster introduced an automatic strength tester that enabled systematic measurements
of the breaking strength and strength variation. A quantum leap in strength testing was the
introduction in 1992 of the Uster Tensojet high-speed strength tester, which performs 30,000 tests
per hour. With this system, it was possible for the first time to recognize isolated weak places in
yarns. These weak spots are frequently the reason for end breaks on weaving machines.
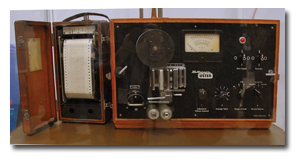
Figure 3: Uster displayed its first evenness tester with one sensor at ITMA Asia + CITME
2008.
Quality Management System
The application of a complete quality management system (QMS) in all yarn production process
steps helps to reduce waste and therefore save money.
The introduction of automatic winding machines in the ring-spinning process in the early
1960s triggered the development of the first monitoring system on this machine. The electronic yarn
clearer, developed by Uster, enabled identification of troublesome thick places and their
replacement by a knot. The data system on the winding machine could monitor all the clearers.
In 1968, Uster introduced the Uster Classimat classifying system to analyze troublesome
thick places in detail. With this system, it could be determined which thick places had to be
eliminated by the winding machine. With the classified faults and the clearing curve, the head of
the winding room could also determine the number of cuts required per 100 kilometers to eliminate
the most troublesome faults, and, therefore, improve the efficiency of the machine.
Blowroom
In the early 1970s, the labor-intensive blowroom was automated with the introduction of the
chute feed system. The random feeding of tufts into cards has caused higher mass variations of the
card sliver. Uster responded with a successful card autoleveling system, which eventually was
applied on drawframes as well.
The target of a QMS in the blowroom is to minimize short fibers and neps and to reduce
unevenness in the sliver. In the mid-1970s, data systems for spinning mills were developed for the
purpose of monitoring all the production positions in spinning preparation, spinning and winding.
Slivers in spinning preparation were permanently monitored for evenness and count deviations. If
predefined quality characteristics were exceeded, a warning lamp directed the attention of the
operator toward the malfunctioning position.
Another data system served to monitor all the spindles of a ring-spinning machine. For this
purpose, a sensor moved along the ring rail and checked the number of rotations of each ring
traveler. If a traveler came to a standstill, it indicated an end break. If the traveler did not
move at nominal speed, it indicated a slow spindle. Because 10 percent of the spindles produced 50
percent of all end breaks, it was of high interest to repair or clean these positions.
High Volume Instrument
A breakthrough in the mid-1970s was the installation of the High Volume Instrument (HVI) for
cotton classing in the United States. This development was the outcome of cooperation between the
US Department of Agriculture and the US electronics industry after several years of intensive
studies. With this fiber bundle testing system, all the important quality characteristics for fiber
classification could be determined within a few seconds. This instrument also has boosted the
application of fiber testing as a tool for optimum blends in spinning mills. Uster acquired the two
companies involved in this development in 1990 and 1993.
A single fiber testing device, the Uster Advanced Fiber Information System (Uster AFIS), was
introduced in 1993. This measuring instrument allows the automatic count of the number and size of
neps for the first time. Additional functions of this instrument are the determination of fiber
length and short fiber content, based on an end-aligned staple diagram, and the maturity and
diameter of the fibers.
Since 1997, a sensor for the evenness tester has been able to precisely measure the
remaining dust and trash particles in yarns. This sensor made it possible for the first time to
monitor the efficiency of carding, combing and open-end (OE) rotor spinning. In the same year, an
optical sensor was integrated into the evenness tester. The sensor could determine the yarn
diameter, the diameter variation, the evenness at very short cut length and the deviation from a
circular cross-section.
Benchmarking
In order to compare quality characteristics in the spinning laboratory with those in world
production, Uster established a number of benchmarks. The first Uster Statistics were introduced in
1957. The evaluation of thousands of samples worldwide has shown that the average number of neps is
equal to 300 neps per gram for a fiber length of 28 millimeters. The best cotton samples have only
about 120 neps per gram, and the cotton samples with the highest figures have 450 neps per gram. In
long-staple cotton, fewer neps are measured because a considerable amount of this cotton is
roller-ginned. These statistics – for example, measuring of neps, trash, dust and the maturity of
fibers – are now available for cotton fibers and all kinds of yarns.
The objective in carding, drawing and combing is to reduce neps and short fiber content as
well as sliver unevenness. Neps degrade the appearance of fabrics considerably. Neps do not exist
in cotton bolls; they are produced by ginning, opening and cleaning of the cotton. There are two
types of neps: fiber neps, defined as an entanglement of fibers, formed under mechanical treatment;
and seed coat neps, fragments of cotton seeds with remaining fibers. They are produced mainly in
ginning when the fibers are separated from the cotton seeds.
Trash and dust particles are foreign particles that are mostly part of the cotton plant,
such as leaf or stem fragments. These particles need to be extracted during the ginning and
spinning process. In ginning, objectives are to minimize the destructive impact of the ginning as
such and to reduce the formation of short fibers and neps.
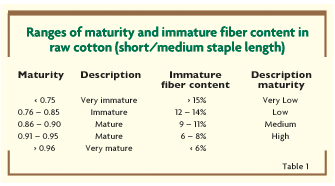
Fiber maturity is an important quality parameter for cotton. In order to calculate the
amount of immature fibers, the cross-section of the fibers has to be compared with a fiber of the
same circumference, but with a circular cross-section. The immature fiber content is the percentage
of all fibers within a cotton sample that have a cross-section covering less than 25 percent of
fibers having the same circumference and a circular cross-section.
As reference figures, Table 1 can be used for short- and medium-staple cotton. Table 1 is
considered as a general rule for raw cotton.
Outlook
The change from manual to automatic processes in the textile industry has often boosted new
developments in textile electronics for monitoring particular machines. The current-generation
Uster Tester 5 has six sensors for an accurate specification of yarns (See Figure 4). The laboratory system is able to determine the evenness; number of thin
places, thick places and neps; periodic mass variations; variance-length curve; hairiness;
remaining dust and trash particles in yarns; diameter; diameter variation; roundness; density;
number of foreign fibers; and count.
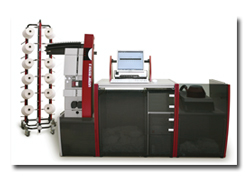
Figure 4: The Uster Tester 5 current generation of evenness testers features six
sensors.
The spinning technology of today does not yet enable the production of fault-free yarns.
Most spinning mills have installed monitoring systems on either the OE rotor or the winding
machines to eliminate such faults. An average spinning mill has between 20,000 and 40,000
production positions. Because of mechanical problems or contamination of the production positions,
outlier bobbins or packages that do not fulfill the expectations with respect to count, count
variation, evenness, imperfections, hairiness, strength, elongation and such can occur every day.
An effective and comprehensive QMS is therefore of utmost importance in order for a spinning mill
to be competitive. Because one single bobbin out of tolerance can destroy a considerable amount of
a textile fabric, it will be an important task of the textile electronics industry in the next five
years to recognize such bobbins and eliminate them from the spinning process.
September/October 2008